Hi all,
April's newsletter is out! If you'd like to read, please click here to subscribe. The tl;dr version is simple: there's a new high yield strategy that is becoming more attractive thanks to market volatility, while my concerns about property REITs and junk bonds are growing. I expect to do a lot of selling and buying in May, but April was a great month to sit back and watch the trends unfold.
If you want all the details, please subscribe--it's free!
Wednesday, May 4, 2016
Monday, February 29, 2016
February Newsletter
The bottom line for February: much ado about nothing.
In the first two weeks of the month, fears were mounting and the big bad "R" word (recession, of course) was being whispered both in the halls of investment banks and in the popular press. I was quite astounded to hear both investment bankers and lay investors talk seriously about a looming recession. Seeing red on Bloomberg terminals, analysts couldn't help but be convinced something terrible was around the corner.
I didn't for once think a recession was nearby, so when the month ended with a surprise 1% GDP revision from the BEA, I was unsurprised. My viewpoint was also rewarded in my own personal high yield portfolio, which was down as much as 3% in mid-February, causing me to increase my purchases of both diversified high yield and investment grade bond CEFs and one equity CEF--NIE, which remains one of my favorite funds in the market. I ended February up YTD for the first time, without even accounting for dividend payouts.
From a chart standpoint, February was the month of intense fear ending in intense relief, resulting in a U-curve for high yield asset classes.
All asset classes mirrored SPY for February, which ended the month up 0.71%. That sounds better than high yield, but its YTD volatility has been worse than high yield bonds and REITs.
2016’s performance and the U-curve of February tell us some interesting things about market attitudes to each of these asset classes, and the future of high yield sectors broadly in an increasingly uncertain interest rate environment.
High Yield Debt
The fact that corporate defaults are still rising, but high yield bonds are not falling significantly in price. In part, this isn’t too surprising, since high yield spreads have risen tremendously in the past year and are at their highest point since 2011 and far above their pre-crisis average, as discussed in last month’s note.
Seeing this trend, I argued last month that well-managed bond closed-end funds will benefit from higher yields on bonds while falling NAVs will become a less pressing concern for funds with low portfolio duration and little leverage. This is why I spent February buying some Pimco bond CEFs, and I’m happy with the purchases.
Looking at the CEF world, we see that plenty of names are still not far from their 52-week low and attractive yields with relatively low risk are still being offered by the market. Although the lows of the February are over, opportunity still exists in both buy-write CEFs and bond CEFs, with high discounts and sustainable payouts. This should embolden investors to double down, ignore the “recession” criers, and enjoy a high sustainable income stream. While I was very negative about high yield in late 2015, I am just as confident now that buying and holding select, well-managed high yield CEFs will deliver alpha for 2016.
REITs
Some property REITs have seen intense, ridiculous sell-offs in 2016, reaching 52-week lows in the middle of February. This was a clear buying opportunity, and the earnings results of some property REITs showed strong FFO growth and sustainable dividend payouts. While some REITs guided for disappointing FFO growth in 2016, there is still growth. Occupancy rates also appear high and growth is also in the cards for the best REITs. Finally, low price-to-FFO multiples at DLR, HPT, HCP, and LXP despite low risk profiles in these companies relative to other REITs makes for a lot of opportunities to buy income. As with bond CEFs, REITs enjoyed bargain prices in February as fear overcame investors.
BDCs
We are nearing the end of the BDC earnings season, and the results are not terribly surprising. High-quality BDCs like MAIN, ARCC, TCAP, HTGC, and FSIC saw strong NAV resilience, NII increases, and/or strong stock performance. Others, like PNNT, PSEC, MCC, and FSC had lackluster performance and some NAV declines. Although February was not a bad month for BDCs, especially for those who remember the fiendish declines of 2014 and 2015, the market has continued to punish poor BDCs with huge discounts to NAV. Value investors are being fooled into buying assets at a discount in the fallacious belief that the assets are ridiculously undervalued. This is an old argument and it doesn’t work any more now than it did in 2014. For instance, when PSEC was trading at a 15% discount people said it was a silly underpricing. Now that the discount is 37.5%, several SeekingAlpha writers are again arguing the discount is silly. But it isn’t. PSEC’s NAV has fallen by 10% over the last few quarters and there are still overpriced CLOs in the portfolio.
The dynamics in the BDC market are a learning opportunity: buying assets at discounts does not equal prudent investing, as those who bought MAIN at a premium have outperformed just about any other BDC investor. There are other things to look at, especially with BDCs, including fee structure, management incentives, portfolio construction, and other issues.
With that in mind, I see little reason to buy BDCs right now, even MAIN. The yields are lower than many investment grade bond CEFs whose debt portfolios include higher quality, larger companies less likely to go into non-accrual or default. When MAIN and FSIC yield over 10% including specials, I will buy both funds. Until then, I remain on the sidelines in the BDC world.
Thursday, January 28, 2016
January Newsletter
I've begun looking at high yield investments through the lens of their 52 week low; as these begin to trade more and more as a group on a reflection of macro expectations--i.e. the FOMC's rate decisions, oil prices, Chinese growth, etc.--it makes more sense to first categorize them according to how much they're off their 52-week low and then make purchasing decisions accordingly.
This isn't to say that simply buying those shares that are nearest their 52-week low is the best decision. For instance, many BDCs nearer their 52-week low (MCC, GBDC, SLRC) are substantially worse buys than others that are far above their 52-week low. Likewise, highly volatile CEFs like PHK can come close to their 52-week lows at a given point, then quickly bounce back but all the while my buy/sell position remains the same. Thus l use the 52-week low metric as a starting point for selecting funds, and then look at dividend coverage, portfolio composition, duration of holdings, sector exposure, and other fundamentals before making my purchasing decision.

The BofA Merril Lynch High Yield Master II Option-Adjusted Spread has skyrocketed to its highest point since 2011 and far above its inter-recession average between 2001 and 2008.
What does this mean for corporate bond CEFs? Two things:
1. New high yield (and investment grade) corporate bond issues pay a higher coupon. Income investors interested in clipping coupons and collecting dividend payments over a long period will be rewarded with higher income if they buy new issues. This applies for CEFs as much as individual investors.
The significance of this is clear: funds with more dry powder will have better dividend coverage. Funds that have been deleveraging, lowering duration, and cutting dividends in recent years (several Pimco funds, as well as NCV and NCZ) will be best positioned to do this, although the distribution-to-NAV ratio for some (PHK, NCV, NCZ) is unsustainably high and thus should be avoided.
2. Holdings will fall in mark-to-market NAV. In other words, the sticker price for a bond CEF is likely to go down in the short-term. This means there is likely to be market price volatility as long as the yields on corporate bonds go up. The way this works is as follows:
Step 1. Corporate bond NAV goes down
Step 2. CEFs see their cumulative NAV go down
Step 3. Markets see CEF NAVs go down, sell off, making market price go down
Step 4. Discounts to NAV expand, creating buying opportunities
If a fund is well managed and not overly levered or have too high of a distribution, this trend is extremely good for holders and buyers of bond CEFs, and is an opportunity to buy more.
However, timing is important, which is why I went 100% into cash in November and only in mid-January began making small purchases of some corporate bond CEFs. I will discuss this in a future SeekingAlpha article, but I will say now that I purchased the following: PDI, PFL, PFN, PTY, PCN, NIE. I am eyeing other CEFs but am waiting for future FOMC meetings and how they impact junk bond yields.

Real estate investment trusts have been hit hard on market jitters. This is largely the result of expectations of a worsening economy or the possibility of an outright recession.
While I do not fear these outcomes and see a strong economy relative to the recent past, I do expect more market volatility as the yields on these remain relatively low. I am looking at purchasing OHI, O, LXP, DLR, and HPT when they hit my price targets.

To say BDCs have been disappointing would be an understatement. Market fears of a worsening macroeconomic environment, fears of defaults triggered by the fall in oil, fears that the strong dollar will hurt GDP growth, and fears that the Fed will keep raising rates are hurting these names broadly.
I remain on the sidelines until we see posted Q1 and possibly Q2 GDP figures before considering adding BDCs to my portfolio.
Wednesday, December 30, 2015
December Newsletter: BDCs Plummet, High Yield Divergence, REIT Safety
Overview
December, default fears were exacerbated by anticipations of a wider high yield spread due to an increase to the Federal funds rate target. As a result, high yield bonds saw sudden and extreme declines, as seen by the fall in HYG, the iShares high yield corporate ETF:
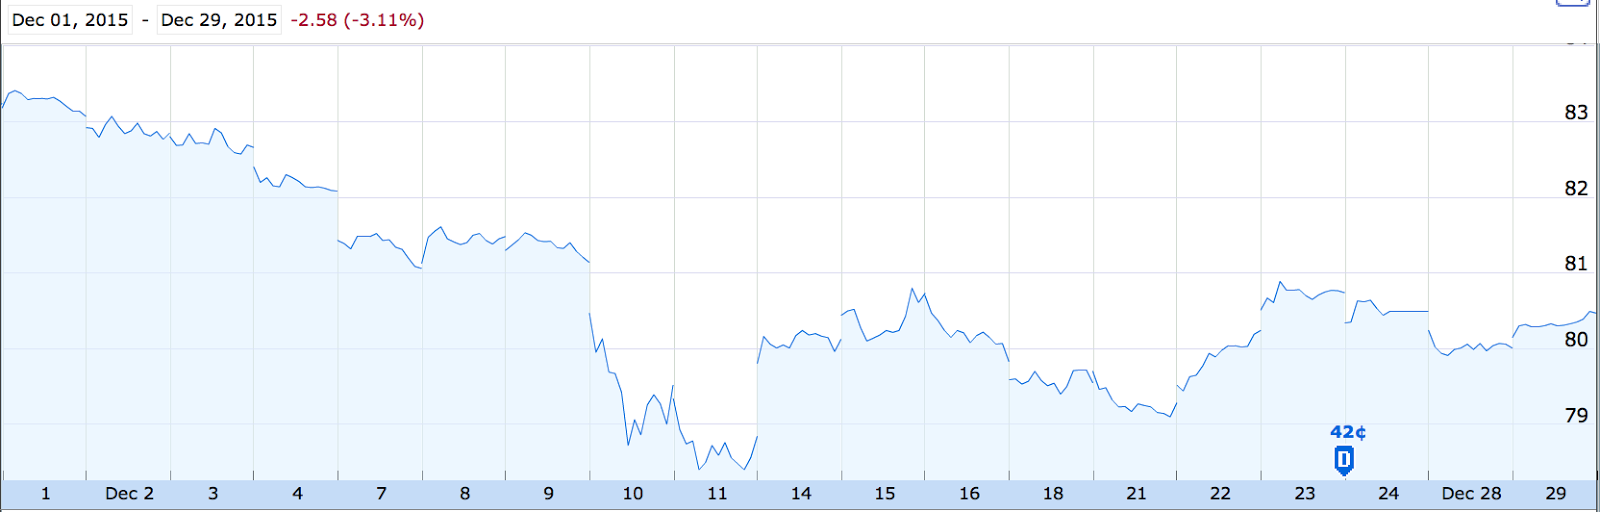
The decline was partly the result of excess selling pressure from investors looking to escape the high yield market, causing several junk bond funds to liquidate and freeze redemptions.
At the same time, U.S. equities have seen a week December despite seasonal tailwinds that usually cause the end of the year to show some improvement over the broader year’s trend. At the time of writing, the S&P 500 is up 3.48% including dividends, and up 0.9% excluding.
BDCs experienced extreme volatility, reversing the November outperformance and causing the ETF that tracks the sector (BDCS) to lose 5% in a month. The selling pressure spared BKCC, a strong outperformer for the year, but did not spare so-called “best of breed” BDCs that have been favored by the market in recent months, notably Main Street (MAIN), TPG Specialty Lending (TSLX), and Gladstone Capital (GLAD), which went from being up YTD to being flat or slightly negative (in the case of MAIN and TSLX respectively) to sharply negative (in the case of GLAD).
While CEFs investing in high yield assets saw a sharp downturn at the beginning of the month, the sell-off has not continued and several high yield CEFs are roughly in-line with their price point of a month ago. At the same time buy-write CEFs have seen a sharp downturn in value that is likely to be short-lived (see below).
In economic data, oil continued to fall as the export embargo brought WTI futures to $35 a barrel before seeing a slight recovery to around $37 as of the time of writing. Third quarter GDP rose by 2% annualized in the third quarter, based largely on private inventory investment—a leading indicator of more retail activity in the future. However, corporate profits fell 1.7%, implying further potential difficulties for debtors, particularly with lower credit ratings and higher coupon rates.
1. REITs

While some property REITs saw a slight improvement in pricing in December, many saw prices little change in the past month. The standout exception is Digital Realty Trust (DLR), a topic we covered in two articles: 1, 2. In both articles we pointed to strong tailwinds that were undervalued by the market. Meanwhile, Lexington Realty Trust (LXP) has seen a significant decline that has made its price-to-FFO more attractive, especially in light of its high dividend coverage, as discussed here.
2. BDCs

BDCs have seen accelerating volatility in the last month after a very difficult year, with only BKCC being spared the carnage. Regardless of credit quality, dividend coverage, or perceived portfolio quality, BDCs with few exceptions are down YTD excluding dividends, and most are still down YTD including dividends. The extreme volatility may continue, but also indicates a clear need for set price targets to enter and exit these names as the vicissitudes of the credit market impact these lenders.
3. CEFs

Sell-offs among high-yield CEFs were not as severe as in the BDC world, with some notable exceptions. However, sell-offs relative to NAV declines were not as severe as one would expect from a rational market, as discussed in this article. This presents an income-seeking investor with a dilemma; to truly maximize the profit potential of buying these CEFs, price targets and entry/exit points will be essential to avoid the losses that have accrued for names like NCV, PHT, and NCZ. The fact that interesting performance divergences are appearing between similar funds, such as between PHK and PHT, underlines the importance in careful fund purchases in this volatile universe.
Monday, November 30, 2015
November Newsletter
Overview
In November, default fears returned with falling oil prices leading to concerns of energy companies struggling to repay debts. Additionally, many REITs saw declines later in the month with fears of rising rates making debts more expensive for these firms. Closed-end funds that focus on corporate bonds also struggled as a result of these risks and greater fears of lower liquidity.

Macroeconomic data remains mixed in the United States, leading to more confusion and volatility in bond and equity markets. On the one hand, the BEA reported personal incomes rose by 0.4% in October, a sharp acceleration from September, and the CPI rose an annualized 2.5% in October; excluding food and energy, the CPI was also up 2.5% in October. On the other hand, personal consumption expenditure rose only 0.1% in October and GDP growth decelerated to 2.1%. While the CPI and personal income growth fueled speculation of a December interest rate hike, low PCE and GDP growth indicate American companies may continue to struggle to raise revenues and earnings.
1. REITs
Despite strong and improving funds from operations (FFO) in many cases, real estate investment trusts have been punished by the market throughout 2015. In November, many property REITs suffered capital losses despite many reporting steady or improving FFO:

Additionally, occupancy rates have held or risen for the best performing REITs and new investments indicate the likelihood of continued rising dividends. The fears of an interest rate hike have caused these funds to see capital outflows both in November and for most of 2015.
Exceptional strong performer DLR benefited from high investor expectations throughout October, when the company's stock rose 13.2% before reporting Q3 FFO of $1.32 that was 5 cents above expectations. The company also reported $33 million in annualized rental sales and $21 million in annualized rental renewals in the quarter. Combined, those represent 7.7% of the company’s total FFO. On the negative side, DLR reported lower sequential revenue growth with occupancy rates and cap rates stagnating even as debt loads have risen.
2. BDCs
This year has been tough on higher yield investments including mREITs, MLPs, bond funds and BDCs, for many reasons including higher yield expectations from investors potentially from interest rate and credit cycle concerns, oil prices, and general market volatility.

Many of these investments hit a low in late September, along with the general markets, and then rallied through October. However, BDCs have rallied much more than the others during November for a few reasons including a positive earnings season. More importantly, many companies reported higher investment yields and the potential for a strong Q4 including portfolio growth and pricing. BDCs with recent repayments and/or leverage capacity will likely take advantage of the uptick in credit spreads. I am expecting a certain amount of tax-loss related selling in December followed by a rebound similar to 2014. There is a good chance that BDCs will report a strong Q4, that could lead to a sustained rally in 2016.
3. CEFs
High yield and corporate bond focused closed-end funds began to see some market price recovery in early November, but more recent concerns about interest rates continue to plague the CEF universe. Of the funds we track, only two (ETW and CII) have a positive YTD performance excluding dividends, due to their investment strategies. ETW is a buy-write fund that uses a covered-call strategy to provide high income to investors while maintaining exposure to equities. This equity exposure has caused the fund to lose 2.8% of its value in November.
Similarly, BlackRock’s CII invests in stocks and sells calls to boost distributions. This fund has maintained its dividend for three years—although that dividend was funded partly by a return of capital in 2014. With largely horizontal performance in 2015, a covered-call strategy has easily outperformed the S&P 500. We expect a covered-call strategy to continue to outperform the market, even though a brief and shallow end-of-year rally in equities may already be beginning.
Finally, funds with high yield corporate debt exposure have seen varying net asset value declines as stock prices fell apace, with discounts steepening for most funds to 52-week lows; in some cases, discounts have reached their lowest points since 2008. At the same time, some funds have become more dependent on ROC to fund distributions. In addition, some funds have extended their duration exposure as low yields on corporate bonds make it difficult for them to cover distributions. Others have cut dividends. The performance of these funds is likely to change markedly in 2016 if interest rates rise.

The Bloomberg USD High Yield Corporate Bond Index lost 1.8% of its value in November, and is only 1.5% above its lowest point in early October.

Despite a recent recovery in pockets of the CEF universe, it appears that the market is continuing to anticipate further declines in the high yield universe in the short term, whether due to interest rate exposure, lower liquidity, or rising default risks.
Monday, November 23, 2015
High Yield Investing
High yield investing has attracted significant attention since interest rates on U.S. Treasuries fell in the aftermath of the 2008 global financial crisis.
A growing number of investors are seeking relatively safe high yielding assets, especially in retirement. A number of asset classes offer high yields, and have grown in popularity in the last seven years.
These include:
* Bond funds
* Equity funds
* Real estate investment trusts (REITs)
* Business development corporations (BDCs)
* Master limited partnerships (MLPs)
Some of these investment vehicles offer significant tax advantages by legal structures that allow them to avoid taxation at the corporate level. Many of these funds invest in the debts of small, medium, and large corporations and pass income to shareholders. The purpose of this site is to distinguish between high-quality "best of breed" high yield income opportunities and to provide diversified, risk-adjusted portfolios that help investors enjoy a reliable income stream while avoiding capital losses from high-risk and underperforming funds.
Subscribe to:
Posts (Atom)